System Log

Use the system log to trace call flow activity.
Opening the System Log
-
Open the call flow editor.
-
From the Build menu, select Tasks.
-
Hover over the task and click View Canvas.
-
-
Top-right of the canvas, click Show Task Logs.

System Log Events
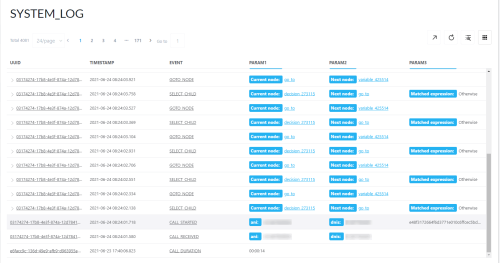
The system log captures event data. For an example system log, see the illustration.
| Column | Description |
|---|---|
|
UUID |
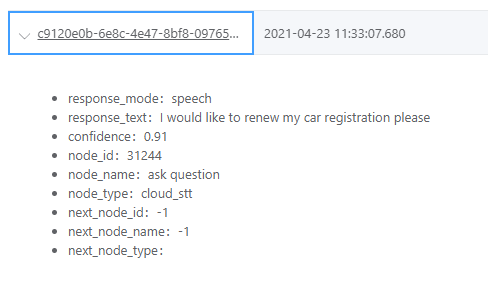
UUID is Universal Unique Identifier. If a > is next to the UUID, click to open Log Details on the event. |
|
Time Stamp |
The time stamp shows the date and time of the event in the time zone selected for the Studio user profile. If a time zone is not selected for the Studio user profile, the time stamp shows the date and time in the time zone selected for the Studio account. |
|
Event Parameter 1 Parameter 2 Parameter 3 |
Show the logged event and associated parameters. Each logged event has up to three associated parameters. Logged events include the following:
For more information on events and their parameters, see System Log Events. |
Linked Tasks
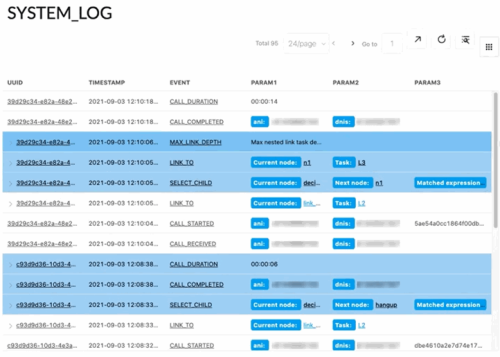
Where tasks are linked, open the parent task in the system log to see the entire call flow. Events belonging to child tasks are highlighted light blue in the system log. Events belonging to children of child tasks are highlighted deep blue.
Click to show the link task node in the call flow or the linked task.
For more information on events and their parameters, see System Log Events.
For more information on the link task node, see Link Task.
Showing the Call Flow
Navigate from a system log event to the related node in the call flow editor.
-
To view the call flow, click Control+hover over the node.
-
To open the call flow editor, click the node.
-
Where linked tasks are used, to open a child task in the call flow editor, click the child task.
Filter Events
Click an event name to filter the system log to show only events with this name. Click Refresh to show the entire system log.
System Log Actions
| Actions |
|
Description |
|---|---|---|

|
Export Data |
Export the system log to a local CSV file. |

|
Refresh |
Refresh the data on the screen. |

|
Filter |
Filter on any of the following: UUID, timestamp, event, param1, param2, param3, node ID, node name, no match attempts, no input events Follow these guidelines when building query conditions:
Note:
While using preview, click the column settings icon to show or hide columns in the datastore.
|
|
|
Column Settings |
Show or hide columns in the system log. |
Debug Mode
Show more events in the system log. For information on the events shown in debug mode, see System Log Events.
To enable and disable debug mode, see Task Properties.
Length of History
The system retains log data for one month.


